The Chokepoint Ledger
What the U.S.–Iran war and constrained Strait of Hormuz flows mean for major defense contractors, upstream producers and refiners.
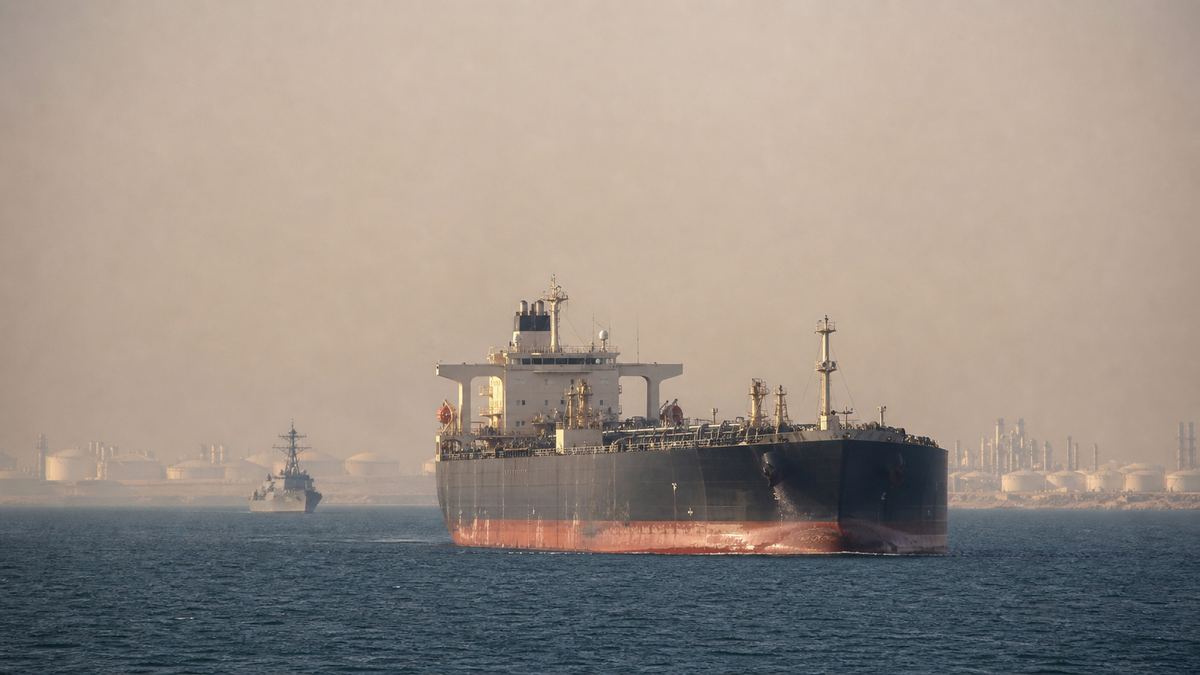
The most accurate description of the U.S.–Iran confrontation on Sunday evening was an attack pause, not a ceasefire. The United States and Iran had paused direct attacks for a second day while intermediaries explored a vessel-transit arrangement. Yet the U.S. blockade remained in force, commercial traffic hovered near a three-week low and no durable agreement had been announced. That difference—between headlines and hardware—is the foundation for analyzing every defense and energy name in this report.
Bottom line Peace would remove a price premium; it would not refill a missile magazine, repair a tanker or rebuild a fuel inventory. The durable defense story is replenishment. The durable energy story is physical deliverability. Neither can be valued from the oil ticker alone.
Hormuz is not an on/off switch
Current statusAssociated Press reporting said the developing compromise could give Iran a role in administering transit with fewer restrictions, though Tehran maintained that the strait’s status had not changed. Reuters reported that fewer than 10 commodity vessels per day crossed during the weekend. Brent fell roughly 5% to about $91.89 and U.S. crude to roughly $84.64 as the immediate attack premium eased.
That reaction was logical—but incomplete. Even after an agreement, mines, damaged infrastructure, insurance exclusions, crew availability and the sequencing of blocked traffic can slow normalization. Attribution matters, and so does the lesson from June: a de-escalation headline can be reversed by a single attack.
The U.S. Energy Information Administration estimates that 20.9 million barrels per day passed through Hormuz in the first half of 2025—roughly 20% of global petroleum-liquids consumption and about one-quarter of seaborne oil trade. Saudi and Emirati bypass pipelines can handle only about 4.7 million barrels per day. Almost 20% of global LNG supply also moved through the strait before the conflict. This is a crude, refined-products, natural-gas, fertilizer and petrochemical shock.
The IEA’s July Oil Market Report captures the scale: June global supply remained 9.4 million barrels per day below prewar levels; Gulf exports including bypass routes were about 16.1 million barrels per day, versus 24 million before the war; refinery margins reached four-year highs; and OECD inventories fell 62 million barrels despite emergency government releases.
Defense channel
Weapons consumed → inventories depleted → supplemental funds → contracts → production ramp → deliveries → revenue and margin
Energy channel
Transit impaired → physical barrels/fuel scarce → benchmarks and cracks move → realizations and feedstock costs → cash flow
Defense: a replenishment cycle, not a one-day trade
The Pentagon estimates that more than 50,000 rockets, missiles and projectiles have been used across the Ukraine and Iran wars. A CSIS assessment cited by the Associated Press said rebuilding Tomahawk, Patriot and THAAD inventories could take at least three years. Defense Secretary Pete Hegseth estimated the Iran war’s cost at $37.5 billion. The administration requested $87.6 billion in supplemental funding, while Senate Republicans advanced a roughly $95 billion package, according to AP.
Investment testProposed funding is not a contract; a contract is not a delivery; a delivery is not automatically a high-margin dollar. Investors should track appropriations, funded backlog, annual production capacity, supply-chain constraints and program mix. Reuters noted earlier in the conflict that the simple “buy defense on war” trade had already lost force after an initial surge. Price paid still matters.
RTX · The broadest consumables exposure
RTX reaches many of the conflict’s highest-consumption categories through Patriot radar and interceptors, Tomahawk, Standard Missile and AMRAAM. Second-quarter sales rose 14% to $24.7 billion; Raytheon segment sales increased 18% to $8.27 billion, led by Patriot, Standard Missile and AMRAAM. Backlog reached $289 billion, including $119 billion of defense work, according to company results and Reuters.
What supports the case
- Visible U.S. and allied replenishment demand
- Targets of more than 1,000 Tomahawks, at least 1,900 AMRAAMs and over 500 SM-6 missiles annually
- Large backlog and international air-defense demand
What can break it
- Production bottlenecks and delayed appropriations
- Commercial-aerospace exposure: expensive fuel can hurt airline customers
- Capacity investment arrives before delivery and margin
LMT · The clearest large-cap missile-defense mechanism
Lockheed Martin is directly exposed to PAC-3 MSE and THAAD replenishment, as well as HIMARS, precision strike and the F-35. Second-quarter sales rose 11% to $20.1 billion, free cash flow reached $2.9 billion and backlog approached $230 billion. Missiles and Fire Control sales grew 20% to $4.1 billion. Lockheed also received a $4.7 billion undefinitized contract to accelerate PAC-3 MSE production. See Lockheed’s release.
What supports the case
- Direct exposure to scarce air-and-missile-defense interceptors
- Backlog and production-ramp visibility
- Replenishment demand extends beyond the active conflict
What can break it
- The stock rose 10.6% after July 23 results; expectations are no longer hidden
- Fixed-price program and supplier risk
- Undefinitized work still requires terms, funding and execution
NOC · The structural, long-cycle beneficiary
Northrop Grumman’s exposure runs through B-2 sustainment, B-21, IBCS command-and-control, space systems and strategic deterrence. Second-quarter sales were about $10.9 billion, up 5%, and backlog reached a record $105 billion. Aeronautics sales rose 13%, helped by B-21 and classified work. But Defense Systems operating income fell 38% on development and qualification costs, a useful warning that strategic demand and near-term margin can move in opposite directions. See Reuters’ earnings coverage.
What supports the case
- Multiyear shift toward air defense, stealth and command systems
- Record backlog and strategic programs
- Long-cycle budgets can survive a near-term truce
What can break it
- Development costs and program timing
- Less direct near-term exposure to consumable missiles than RTX or LMT
- Budget priorities can move faster than revenue recognition
GD · Sea-lane security, shipyards and a Wednesday test
General Dynamics is a less direct missile-replenishment trade. Its mechanisms are submarines and destroyers, land combat systems, munitions, secure technology and C4ISR. First-quarter revenue rose 10.3% to $13.5 billion, company book-to-bill was 2.0 and defense book-to-bill was 2.2. Backlog reached $130.8 billion, with almost $64 billion in Marine Systems, according to General Dynamics. Q2 results are due July 29.
What supports the case
- Naval and munitions demand from renewed sea-lane focus
- Strong defense book-to-bill
- Large, durable shipbuilding backlog
What can break it
- Shipyard labor and supply constraints
- Long construction cycles slow cash conversion
- Gulfstream makes GD less of a pure defense exposure
Energy: producers are not refiners
The wrong question is, “Does oil go up?” The better questions are: Which company owns the barrel? Can it produce and transport it? What realized price does it receive? For a refiner, what does crude cost relative to the gasoline, diesel and jet fuel it can sell?
| Company | Primary exposure | War upside mechanism | Hidden offset | Next catalyst |
|---|---|---|---|---|
| XOM | Integrated upstream, refining, chemicals | Higher realizations in the Permian and Guyana | Outages, shipment risk, working capital, weaker chemicals or refining | Q2 results Jul. 31 |
| CVX | Integrated upstream and downstream | Oil sensitivity plus strong U.S. production | CPC/Kazakhstan disruption; downstream and chemical costs | Q2 results Jul. 31 |
| COP | Upstream exploration and production | Cleanest benchmark-oil beta of the group | Qatar downtime proves price cannot help an unavailable barrel | Q2 results Aug. 6 |
| VLO | Refining | Scarce gasoline and diesel can widen crack spreads | Crude-feedstock shortage, demand destruction, fast inventory rebuild | Q2 results Jul. 30 |
Exxon Mobil: higher realizations, integrated offsets
Exxon’s first-quarter production was about 4.6 million barrels of oil equivalent per day and earnings were $4.2 billion, according to its company release. Higher crude supports upstream cash flow, particularly in Guyana and the Permian, but production and shipment disruptions, derivatives, working-capital timing and downstream margins complicate the result. Integration dampens both the upside and the downside.
Chevron: more barrels, plus operational friction
Chevron’s worldwide first-quarter production rose 15%, with U.S. output up 24%, according to company results. That gives the company substantial oil-price sensitivity. The offset is physical exposure: attacks affecting the Caspian Pipeline Consortium have reduced Kazakhstan production, and downstream and chemicals do not necessarily celebrate higher feedstock and energy costs.
ConocoPhillips: the purest oil beta—when the barrel moves
ConocoPhillips lacks the large refining and chemical operations of Exxon and Chevron, making it the cleanest upstream oil exposure in this group. Lower 48 production was 1.453 million barrels of oil equivalent per day in Q1. Yet Qatar downtime forced Conoco to exclude Qatar volumes from second-quarter guidance and reduce its full-year assumption. Its own first-quarter release is the reminder: benchmark price and available production are different variables.
Valero: the crack spread, not the crude chart
Valero’s central variable is the refining crack—the value of gasoline and diesel relative to crude input costs. During the war, the U.S. 3-2-1 crack reached roughly $69.66 per barrel, diesel cracks exceeded $91 and gasoline cracks approached $59, according to Reuters reporting. Valero earned $1.3 billion in Q1, with $1.8 billion of refining operating income and throughput near 2.9 million barrels per day, according to company results.
Valero can outperform while crude falls if finished products stay scarce longer than feedstock. It can also suffer while oil rises if crude becomes unavailable, consumers pull back or inventories normalize faster than expected. That is why “buy the refiner because oil is high” is an incomplete thesis.
Narrative lens
What the PBD/Valuetainment frame gets right—and where investors must go further
Patrick Bet-David and Valuetainment have repeatedly presented Hormuz as a system-level lever connecting oil, the dollar, the Fed and political power, including a recent PBD Podcast discussion. That frame is useful because it forces investors to think beyond a single commodity. But a market thesis still requires verified physical flows, funded contracts, production capacity and company filings. We use the media narrative as a stress-test lens—not as a substitute for EIA, IEA, AP, Reuters or primary financial disclosures.
Four scenarios, eight very different trades
1 · Diplomacy
Durable ceasefire, controlled transit
XOM, CVX and COP likely surrender part of the risk premium. VLO may retain near-term support while depleted product inventories rebuild. Defense headlines cool, but funded replenishment survives.
2 · Current state
Frozen conflict, intermittent attacks
Energy and defense remain headline-sensitive. U.S. upstream benefits from elevated prices; Middle East-linked volumes face outage risk. VLO stays supported while product scarcity outlasts crude scarcity.
3 · Escalation
Hormuz and Bab el-Mandeb both threatened
RTX and LMT have the most direct sensitivity to renewed interceptor consumption. Upstream benefits only on deliverable barrels; VLO may surge on scarcity, then face feedstock and demand-destruction risk.
4 · Reopening
Flows normalize, magazines remain empty
Energy loses much of its war premium. Defense retains the structural tailwind because missiles, shipbuilding capacity and strategic stockpiles take years—not trading sessions—to rebuild.
What proves—or kills—the thesis
For defense, the proof is funded backlog, production cadence and margin conversion. Watch appropriations, contract definitization, supplier capacity and working capital. The falsifier is not peace by itself; it is slower funding, unfixable production constraints or returns that fail to justify the capacity spend.
For energy, the proof is physical: tanker counts, Gulf export volumes, bypass utilization, inventories, crack spreads and company-specific production. The falsifier for upstream is a durable reopening that rebuilds inventories faster than demand absorbs them. The falsifier for refiners is rapid product normalization, crude unavailability or demand destruction.
The simple formulation—war means buy oil and defense—misses where money actually flows. The strongest mechanisms belong to companies that can deliver scarce interceptors, move barrels outside the chokepoint, or turn scarce crude into even scarcer finished fuel. The weakest belong to businesses whose production, shipments or industrial capacity are trapped behind the same bottleneck that created the price spike.
Sources and methodology. Current-status reporting: AP on diplomacy, AP on oil and Reuters’ Sunday update. Physical-market data: EIA and IEA. Military claims are attributed to CENTCOM and are not presented as independently verified. Financial figures come from company releases linked in the text and Reuters/AP. Exposure and scenario conclusions are Aria Vantage analysis, not individualized recommendations.